2024.06.14 - [Monitoring/Grafana] - Grafana > 시작하기
위 글을 먼저 읽자
Loki 한줄 소개
Multi-tenant 로그 집계(Aggregation) 시스템
모든 애플리케이션과 인프라로부터 로그를 저장하고 질의한다
Multi-tenant
Tenant의 사전적 의미는 세입자, 임차인, 소작인이다
멀티 테넌트는 여러 사용자가 같은 시스템을 공유하면서도 서로 독립적으로 운영할 수 있도록 하는 시스템 아키텍처를 말한다. 하나의 애플리케이션에 여러 테넌트를 지원하여 각 테넌트의 데이터와 설정을 격리할 수 있다
개요
로그 행의 전체 텍스트가 아닌 오직 메타데이터(각 Log stream의 레이블 집합)만 인덱싱한다
Log stream은 같은 레이블을 공유하는 로그 집합을 말한다
최소한의 인덱싱 처리 방법으로 다른 솔루션에 비해 훨씬 작은 저장소를 요구한다
로그 데이터는 압축되어 아마존 S3 등과 같은 객체 저장소에 Chunk로 저장된다. 또는 개발 또는 POC(Proof Of Concept, 개념 증명) 목적으로 파일시스템에 저장된다
전형적인 로키의 logging stack은 아래와 같다
- Agent
- Promtail 같은 수집기가 로그를 수집하고 레이블을 달아 스트림으로 만든 뒤 HTTP API를 통해 스트림을 로키로 Push
- Loki
- Grafana
Docker Compose로 Loki 실행
https://grafana.com/docs/loki/latest/setup/install/docker/
vi loki-config.yml
(이 글의 본문 조금 아래쪽의 컨테이너 내 기본 설정 파일을 그대로 복붙함)
vi compose.yml
services:
  some-loki:
    container_name: some-loki
    image: grafana/loki:3.0.0
    ports:
      - 3100:3100
    volumes:
      - ./loki-config.yml:/etc/loki/local-config.yml
docker compose up
컨테이너 내부에서 로키가 사용하는 폴더를 확인해보자
docker exec -it some-loki /bin/sh
tree /etc/loki
/etc/loki
└── local-config.yaml

0 directories, 1 files
cat /etc/loki/local-config.yaml
auth_enabled: false

server:
  http_listen_port: 3100

common:
  instance_addr: 127.0.0.1
  path_prefix: /loki
  storage:
    filesystem:
      chunks_directory: /loki/chunks
      rules_directory: /loki/rules
  replication_factor: 1
  ring:
    kvstore:
      store: inmemory

schema_config:
  configs:
    - from: 2020-10-24
      store: tsdb
      object_store: filesystem
      schema: v13
      index:
        prefix: index_
        period: 24h

ruler:
  alertmanager_url: http://localhost:9093

# By default, Loki will send anonymous, but uniquely-identifiable usage and configuration
# analytics to Grafana Labs. These statistics are sent to https://stats.grafana.org/
#
# Statistics help us better understand how Loki is used, and they show us performance
# levels for most users. This helps us prioritize features and documentation.
# For more information on what's sent, look at
# https://github.com/grafana/loki/blob/main/pkg/usagestats/stats.go
# Refer to the buildReport method to see what goes into a report.
#
# If you would like to disable reporting, uncomment the following lines:
#analytics:
#  reporting_enabled: false
tree /loki
/loki
├── chunks
│   └── loki_cluster_seed.json
├── compactor
├── rules
├── rules-temp
├── tsdb-shipper-active
│   ├── multitenant
│   ├── per_tenant
│   ├── scratch
│   ├── uploader
│   │   └── name
│   └── wal
│       └── filesystem_2020-10-24
│           └── 1718582856
│               └── 00000000
├── tsdb-shipper-cache
└── wal
    ├── 00000000
    └── 00000001

14 directories, 5 files
로키가 준비되었는지 확인
http://localhost:3100/ready
아직 준비가 안 됐다면
Ingester not ready: waiting for 15s after being ready
준비가 됐다면
ready
메트릭 확인
http://localhost:3100/metrics
프로메테우스의 메트릭과 같은 형식이다
Grafana에 Loki Data source 추가하기
Open menu > Data soruces > Add data source > Loki 클릭
URL: http://host.docker.internal:3100
(여기서는 로키의 네트워크 모드를 bridge로 설정했기 때문에 호스트 OS를 위한 도메인 사용했다)
Save & test 버튼 클릭
스프링 부트 애플리케이션이 파일 로깅하도록 만들기
예제 코드는 이곳을 참고하자
https://github.com/venzersiz/learn-spring-boot-actuator
로깅 경로는 /Users/Krevis/logs/spring-boot-app이다. 원하는 곳으로 바꿔도 된다
Docker Compose로 Promtail 실행
Promtail은 사전에 있는 단어는 아니며, Prom(etheus) + tail의 합성어로 보인다
여기서는 로키 도커 컴포즈 파일에 프롬테일을 추가해서 관리하겠다
vi compose.yml
services:
..
  some-promtail:
    container_name: some-promtail
    image: grafana/promtail:3.0.0
    network_mode: host
    volumes:
      - ./promtail-config.yml:/etc/promtail/config.yml:ro
      - /Users/Krevis/logs/spring-boot-app:/var/log/spring-boot-app:ro
프롬테일은 네트워크 모드를 host로 설정하지 않으면 잘 동작하지 않았다 (나만 그럴지도?)
스프링 부트 애플리케이션의 로그 파일이 생성되는 경로를 컨테이너의 /var/log 하위에 볼륨 마운트했다
vi promtail-config.yml
server:
  http_listen_port: 9080
  grpc_listen_port: 0

positions:
  filename: /tmp/positions.yaml

clients:
  - url: http://loki:3100/loki/api/v1/push

scrape_configs:
- job_name: spring-boot-app
  static_configs:
  - targets:
      - localhost
    labels:
      job: spring-boot-app
      __path__: /var/log/spring-boot-app/*log
grpc 포트 0은 무작위 포트를 말한다
docker compose up
웹 브라우저에서 http://localhost:9080으로 접근하면, 프로메테우스와 같은 UI가 나타난다
기본 화면은 Targets이다

Grafana에서 Loki 로그 살펴보기
Open menu > Explorer >
Data source: loki
화면 우상단의 Run query를 버튼을 클릭하면 아무 데이터도 조회되지 않는다. 프롬테일과 로키 연동이 뭔가 잘못되었나 싶었는데 원래 그렇다
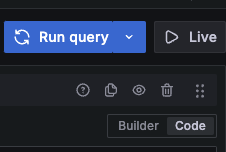
편집 모드는 기본적으로 Code 모드로 되어 있는데 익숙하지 않다면 Builder 모드를 사용하는 것이 좋을 수 있다
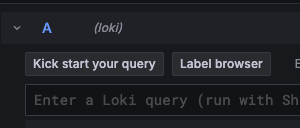
Label browser 버튼을 클릭하면,

위와 같이 현재 사용할 수 있는 레이블이 표시되는데 선택해서 편하게 질의할 수도 있다
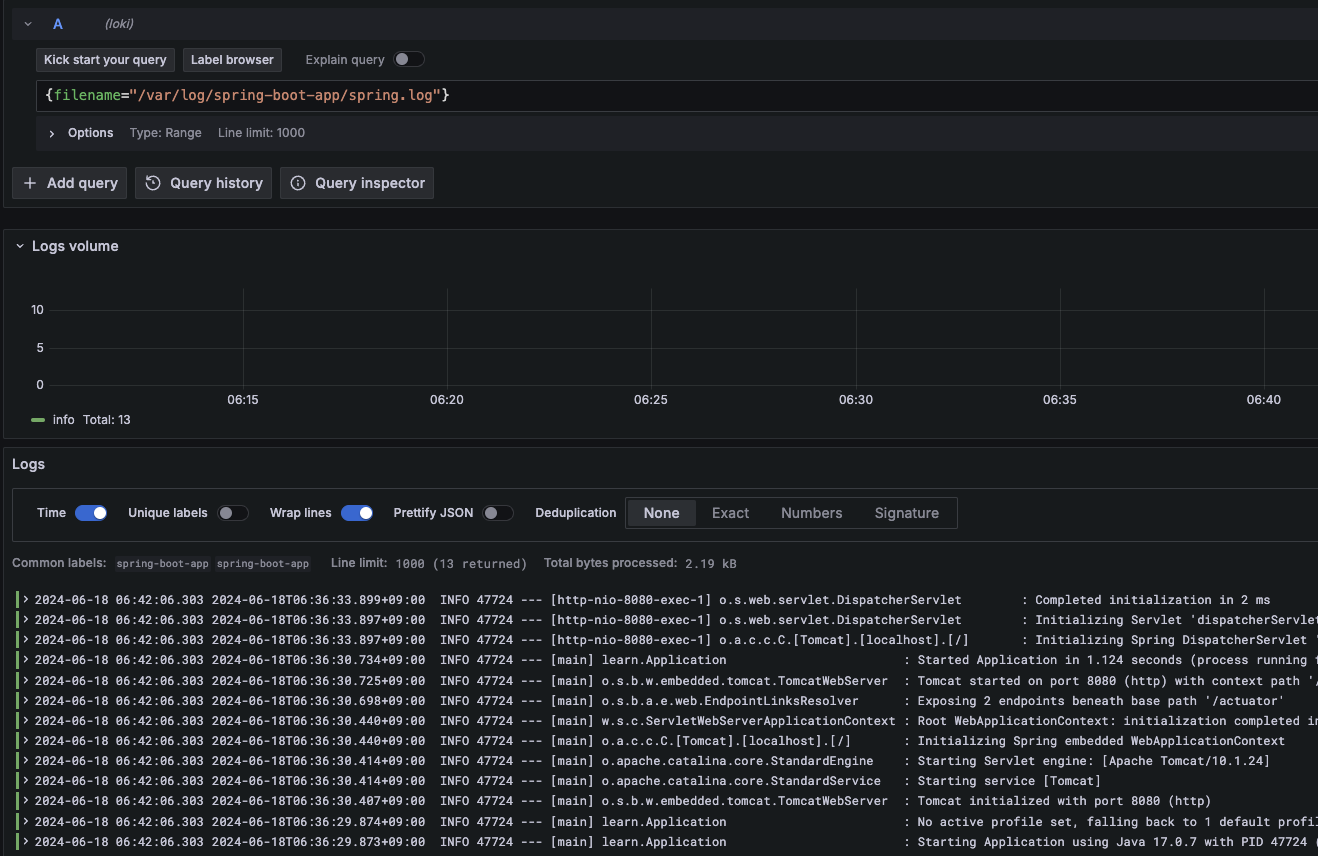
질의를 하면 아래와 같이 그라파나에서 스프링 부트 애플리케이션의 로그 파일 내용을 확인할 수 있다
Grafana에 Loki Dashboard 추가하기
https://grafana.com/grafana/dashboards
Loki로 검색해 마음에 드는 것을 추가한다
Grafana Alloy
Promtail 대신에 Alloy를 사용하려고 먼저 진행했는데, 잘 안 되어서 나중에 다시 하고자 한다
Promtail은 더 이상 개발되지 않는다고 하며 Alloy로 전환되었다고 한다
https://grafana.com/docs/loki/latest/send-data/promtail/
https://openvalue.blog/posts/2024/04/13/replace-promtail-with-alloy/
https://grafana.com/blog/2024/04/09/grafana-agent-to-grafana-alloy-opentelemetry-collector-faq/
https://grafana.com/oss/alloy-opentelemetry-collector/
한줄 소개
OpenTelemetry 수집기
Docker Compose로 Grafana Alloy 실행
https://grafana.com/docs/alloy/latest/get-started/install/docker/
https://hub.docker.com/r/grafana/alloy
vi config.alloy
logging {
  level  = "info"
  format = "logfmt"
}

local.file_match "local_files" {
  path_targets = [{"__path__" = "/var/log/*.log"}]
  sync_period = "5s"
}

loki.source.file "log_scrape" {
  targets = local.file_match.local_files.targets
  forward_to = [loki.write.grafana_loki.receiver]
  tail_from_end = true
}

loki.write "grafana_loki" {
  endpoint {
    url = "http://host.docker.internal:3100/loki/api/v1/push"
  }
}
https://grafana.com/docs/alloy/latest/tutorials/get-started/#configure-alloy
아래 컴포넌트들을 설정한다
- Log files
- 이름이 local_files인 local.file_match 컴포넌트를 만든다
- 어느 파일들이 Source인지 설정
- 5초마다 새 파일을 확인한다
- Scraping
- 이름이 log_scrape인 loki.source.file 컴포넌트를 만든다
- 알로이의 파이프라인 개념을 보여준다
- local_files 컴포넌트를 대상으로 한다
- grafana_loki 컴포넌트에 전달한다
- 추가 속성과 옵션을 설정할 수 있다
- 여기서는 로그 파일을 Tail할 때 끝부터 한다 (전체 과거 이력을 섭취하지(Ingest) 않는다)
- Write logs to Loki
- 이름이 grafana_loki인 loki.write 컴포넌트를 만든다
- http://localhost:3100/loki/api/v1/push를 향하게 한다
컴포넌트명에 대쉬(-)를 사용할 수 없다
vi compose.yml
services:
  some-alloy:
    container_name: some-alloy
    image: grafana/alloy:v1.1.1
    ports:
      - 12345:12345
    volumes:
      - ./config.alloy:/etc/alloy/config.alloy
    command:
      - run
      - /etc/alloy/config.alloy
      - --server.http.listen-addr=0.0.0.0:12345
command 항목을 추가해야 호스트 OS에서 Alloy에 접근할 수 있다
docker compose up
실행된 컨테이너에 진입해 폴더 구조를 확인해보자
docker exec -it some-alloy /bin/bash
cat /etc/alloy/config.alloy
아래 설정은 컨테이너 내부의 기본 설정 파일이다
// This config file is designed to send traces and metrics to the docker
// compose environment from example/docker-compose.

logging {
	level  = "debug"
	format = "logfmt"
}

tracing {
	// Sample all traces. This value should be lower for production configs!
	sampling_fraction = 1

	write_to = [otelcol.exporter.otlp.tempo.input]
}

otelcol.exporter.otlp "tempo" {
	client {
		endpoint = "localhost:4317"

		tls {
			insecure = true
		}
	}
}

prometheus.exporter.unix "default" { /* use defaults */ }

prometheus.scrape "default" {
	targets    = prometheus.exporter.unix.default.targets
	forward_to = [prometheus.remote_write.default.receiver]
}

prometheus.remote_write "default" {
	endpoint {
		url = "http://localhost:9009/api/prom/push"
	}
}
Alloy UI에서 설정 점검하기
위에서 정의한 컴포넌트 목록과 Health를 확인할 수 있다

Graph 메뉴를 클릭한다
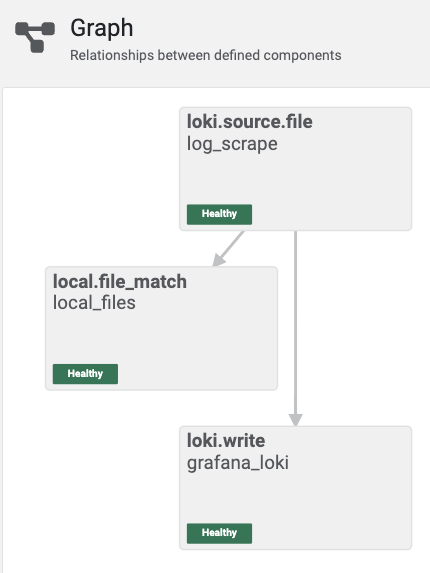
알로이 컴포넌트 설정에 의해 만들어진 파이프라인의 시각적 묘사를 볼 수 있다
'Monitoring > Grafana' 카테고리의 다른 글
| Grafana > 시작하기 (0) | 2024.06.14 |
|---|